

Description
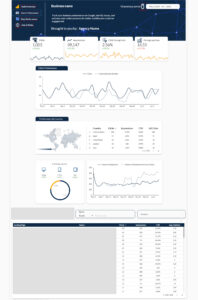
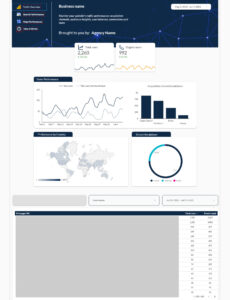
Features of Our DFY Looker Studio and Analytics
Actionable Data Updated Live
Organized Report with Clear Data Comparisons
Client Ready (Set and Forget Client Reporting)
Tag Setup and Goal Tracking (L2 & L3 Packages Only)
No Monthly Fees (For L1 and L2)
Products Specs
Level 1: Basic Setup (Analytics and LookerStudio Setup)
This product includes a fully configured Looker studio Dashboard with the following connectors
configured:
- Google Analytics
- Google Search Console
- Google Ads (formerly adwords)
Note: If the client does not have analytics setup this package includes basic setting up and configuring analytics


Level 2: Custom Goals & Analytics (Analytics, Looker Studio, and Custom Goals)
This product includes all items from Level 1 and also includes the following:
- Configuration and tracking of 5 of the most important events a website (setup with Google Tag Manager)
- Configuration of the 5 events being tracked as “events” in Google Analytics 4 (this allows you to cross-reference conversions with other data available in GA4)
- Tag Manager report of the events being tracked
- Analytics report of the Goals being tracked
Note: If the client does not have tag manager setup, then we will configure tag manager
Add-on Product Specs
This add-on will allow you to have us customize the report to include your company logo, branding, colors, fonts, and any basic design features you would like changed on the report to match your agencies personal branding.
This add-on will allow you to have us integrate data from other platforms you are using (that can be integrated with data studio) that we don’t already offer with any of our reporting plans. Example: Twillio, SendGrid, CallRail, Sales Force, PayPal, Bing Ads, YouTube, Amazon, Constant Contact, Aweber, Wix, etc.
Some Available Data Points
- User Sessions
- Number of New Users
- Unique Pageviews
- Bounce Rate
- Average Session Duration
- Page Impressions
- Visual Comparison of Previous Sessions to Current Bounce Rate
- Visual Comparison of Previous Bounce Rate to Current Bounce Rate
- Browser Source with Pageview Percent by User
- Sessions By County Chart
- Organic Sessions Trending
- Percentage of Clicks by Location
- Device & Clicks Visualization Chart
- Organic SEO Queries by Impressions, Clicks and Traffic Percent
- Top Sources of Traffic Pie Chart
- Visual Chart to Define Days With Most Traffic
- Device Used Visualization Chart with Click Data
- Returning Visitors Visualization Chart
- Top Landing Pages by Sessions and Overall Site Traffic
- Successful Cities Visualization Chart
- Most Engaging Content Data by Percent & Time On Site
- Breakdown of Traffic By Channel
- Sessions by Time of Day Visualization Chart
- Sessions by Month Visualization Chart
- Google My Business Total Searches
- Google My Business Total Views
- Google My Business Total Actions
- Google My Business Phone Calls
- Google My Business Website Actions
- Google My Business Map Views
- Google My Business Directions Actions
- Google My Business Direct Searches
- Google My Business Visibility Progress VIsualization Chart


Reviews
There are no reviews yet.